
- Solutions
Healthcare
- Resources
Patient Access Performance Analytics
Patient-friendly billing. Clean claims. They start right here.

Over 1/3 of the information needed for a claim is created before the patient sees the physician. So we’ve created a proactive approach to healthcare consumer access.
Many analytics start by looking at the wrong end of the revenue cycle: bill holds, rejected and denied claims. But over 1/3 of the information needed for a claim is created before the patient sees the care provider. So we’ve created a very logical solution: Patient Access Performance Analytics.
This solution monitors every phase of a patient’s progress through the cycle of care, from pre-registration to admissions, outpatient registration, discharge, and all the way through billing activities and even transfer. It automatically applies standard and custom rules that isolate errors and omissions at every stage, and helps users take corrective action. With daily scorecards, alerts, and notifications, managers can transition from management by sampling on a few facesheets to management by exception on every account. Then they can develop training programs that greatly improve clean claim ratios.
Key Features & Benefits
- Reviews 100% of registrations via ADT and related data sources
- Applies custom business rules
- Provides daily feedback
- Prompts corrective action for each error
- Validates demographic verification
- Identifies error root causes
- Improves registration accuracy
- Creates true front end financial securement
- Advanced visualizations
We put real intelligence where it belongs. As close to the point of service as possible.
Typically, admissions staff work hard, but aren’t given a real context of how their performance affects patients and the organization. Patient Access Performance Analytics changes that for the better. It makes admissions staff a key contributor to the operational and financial success of the enterprise. Staff understands the root causes of errors, sees why patient access data integrity is important, and gets detailed worklists that help them move the revenue cycle upstream.
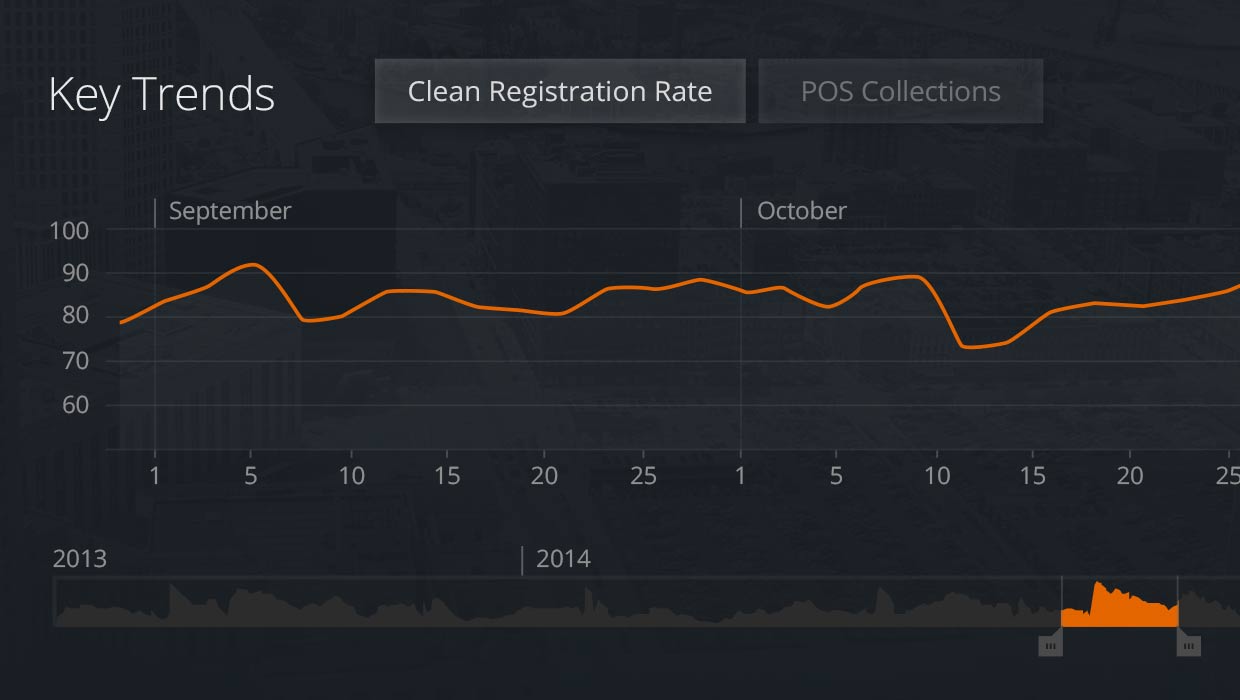
Key Trends
A patient access worker sees a day-to-day trend of her job performance, and learns that clean claims were down to 73% in mid-October from their yearly average of 86%. Patient access analytics have already determined that the problem was caused by three repeated errors, and have given her a prescriptive remedy that is optimizing her clean claims ratio.
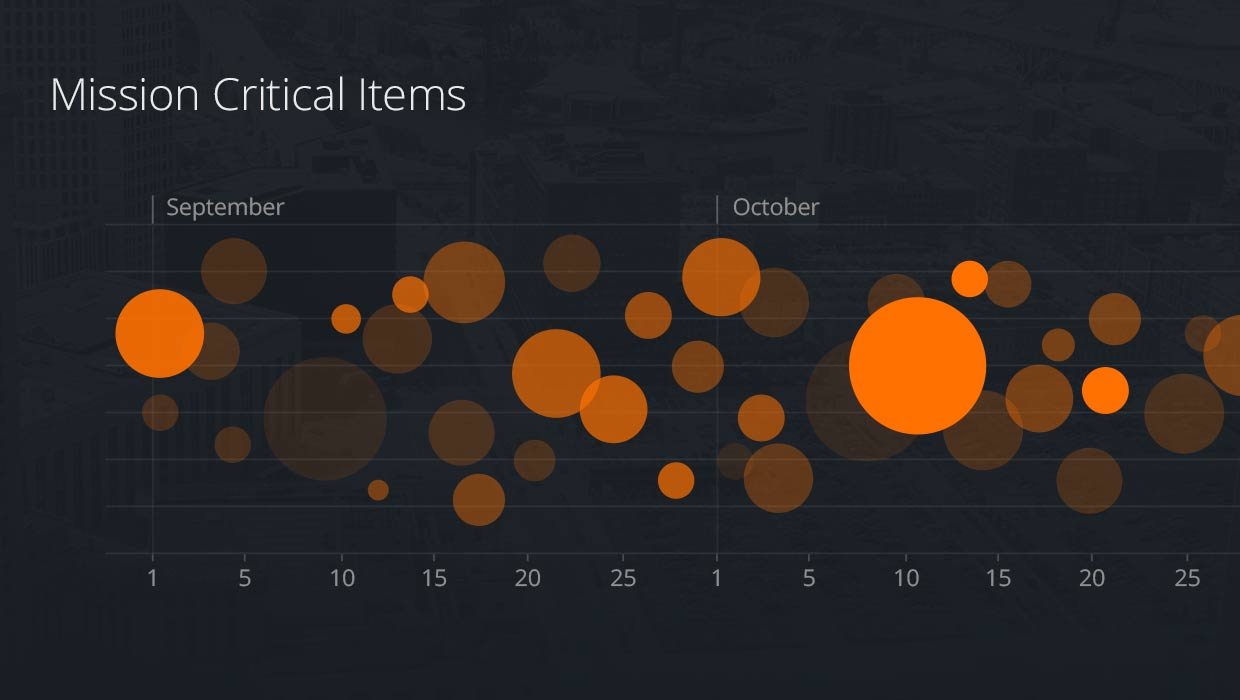
Critical Problem Areas
Staff typically have an intuitive understanding of the Pareto Principle, but this visualization makes it crystal clear that the great majority of unclean claims are being created by the same three errors, repeated many times.
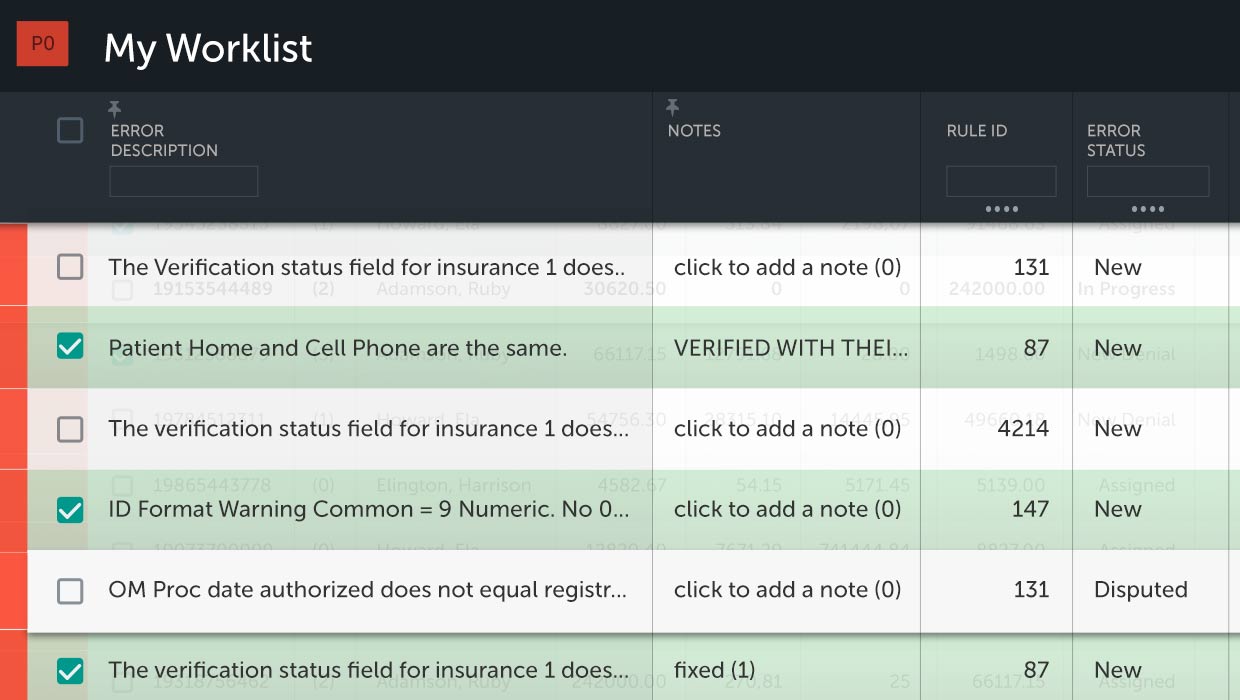
Detailed Worklisting
Our analytics don’t just pinpoint the root cause of a problem and leave the user wondering, “Now what?” We deliver specific, prioritized worklists that help users do exactly what is needed to fix immediate problems, and how to eliminate the on-going systemic or process-related root causes.
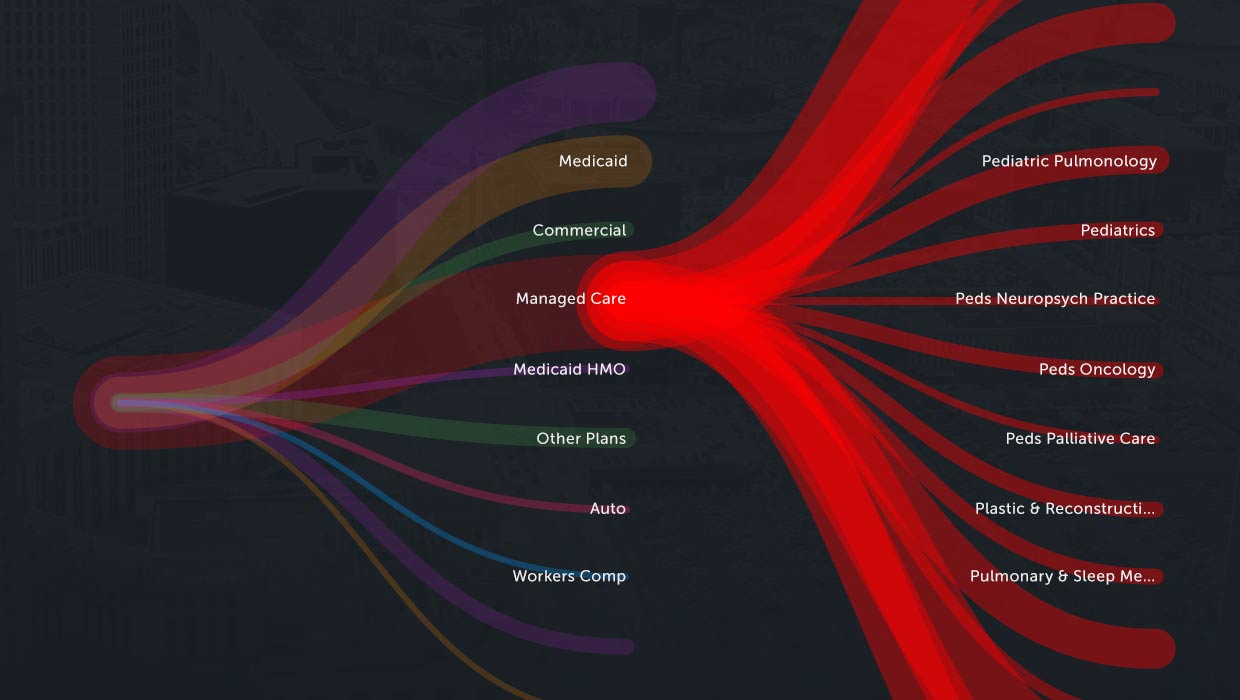
Watch Data Flow
This advanced visualization gives managers and staff a deeper understanding of cause and effect. By adding motion to the data, we help users better see how resolving errors up front has a positive effect that flows through the system, so they understand the full impact of accuracy.
Follow us on social media


© 2024 VisiQuate, Inc. All Rights Reserved.