
- Solutions
Healthcare
- Resources
Workforce Performance Analytics
The best way to fulfill your mission: Understand exactly how your team is helping you get there.
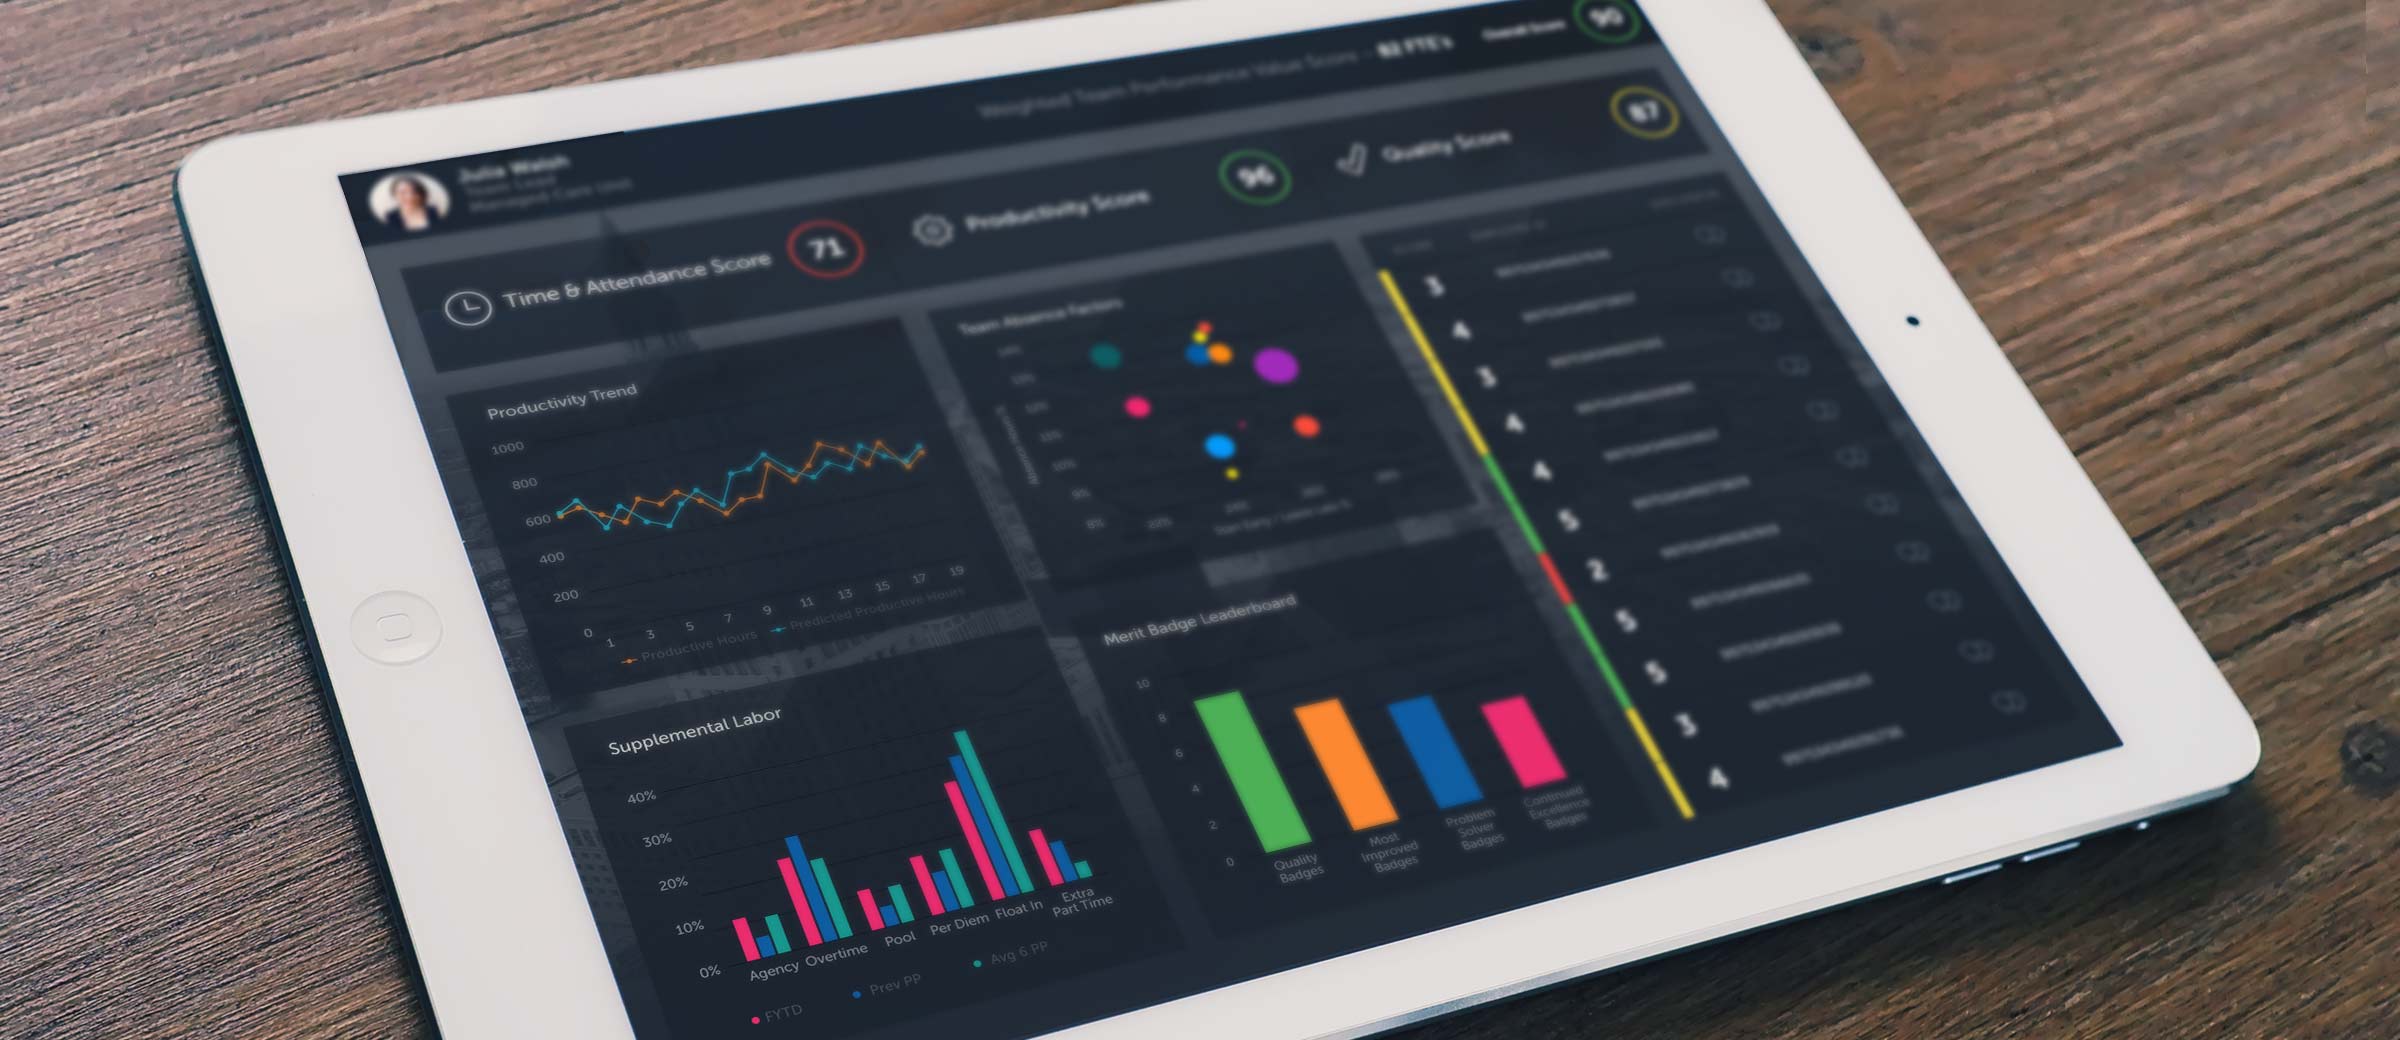
It takes some serious analytics to balance team members' attendance record with their productivity and quality of work. And here they are. Our Workforce Performance Analytics help managers evaluate the total performance of each employee, agent and/or contractor by integrating data that tracks time and attendance, quality of work, and productivity, along with other key perspectives, including employee satisfaction. Most importantly, it lets managers set different criteria for each team member, so a new person with three months’ experience can be compared fairly to someone with ten years’ experience.
With this solution, managers get an objective picture of how each team member adds to – or subtracts from – department performance. So managers have a much more thorough way to reward performance and correct problems. Individual team members also benefit. They get regular updates of how they compare to their peers. They understand exactly how they are contributing to team goals. They can even see how various forms of compensation – from bonus checks to soft currency – increase or decrease with their performance. And when team members have a transparent view of cause and effect, their performance increases, along with their job satisfaction. From there, it’s a very short step to the biggest benefit of all: satisfied customers.
Key Features & Benefits
- Integrates time & attendance, productivity and quality data
- Intelligently selects samples for quick quality reviews
- Gives managers group and individual views
- Performance measures are fully customizable
- Promotes higher departmental performance
- Streamlines quality checking process
- Gives employees transparent view of incentives
- Gamification personalization enhances team member involvement
- Balanced view of total performance
Now you can have totally balanced evaluations. And fully transparent employee motivation.
Every organization has different ways to assess the real contribution of its people. For some staff, time & attendance are paramount. For others, it’s quality and productivity. With this configurable solution, clients assign their own weighted values to each measurement, and we hard-code these criteria. The result? Each team member gets a weighted PVU score (Personal Value Unit) which is a fair, objective measure of overall team member performance. They see exactly where they stand compared to their peers, and whether they need to celebrate or refocus.
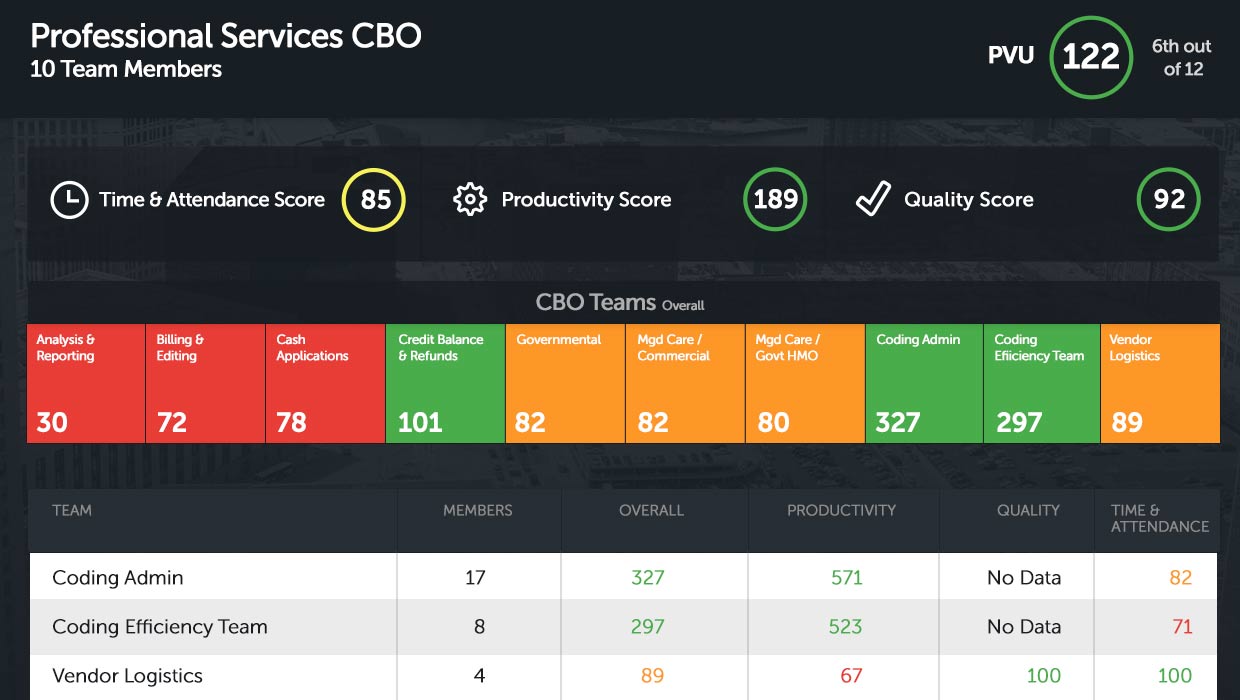
Department View
The manager of a large revenue cycle operation starts by looking at a big picture view of her 12 teams. The department is doing well overall, but she immediately sees that a few teams are lowering the overall score.
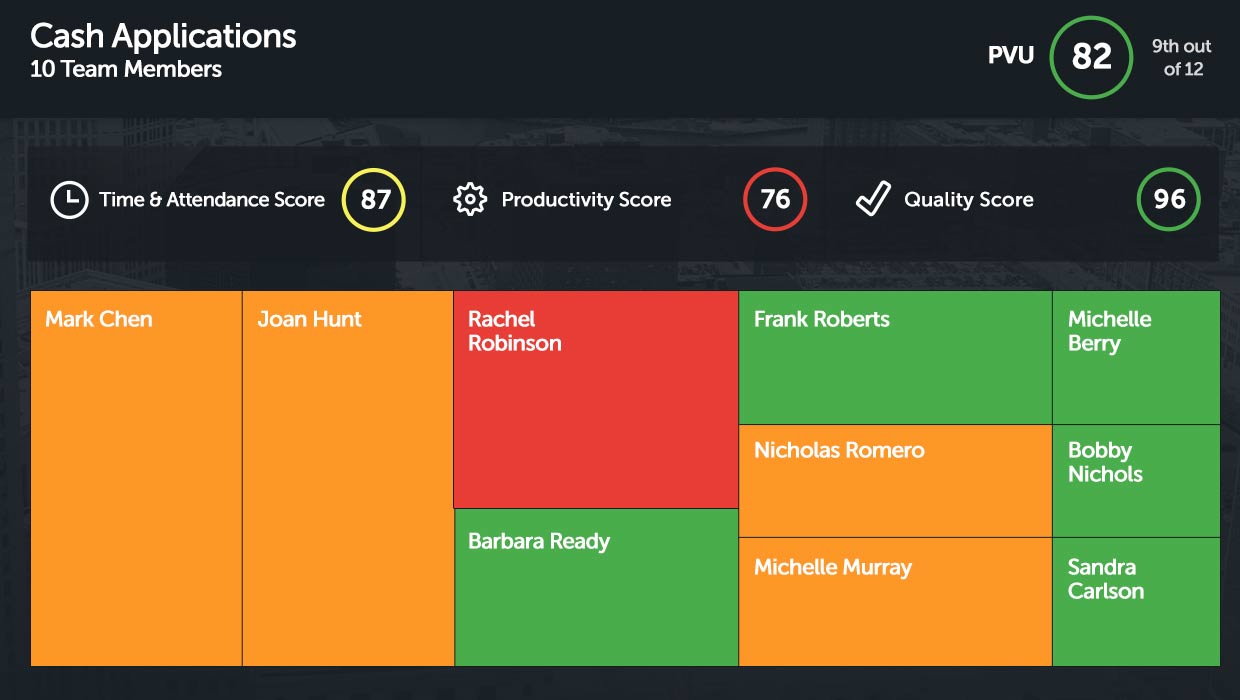
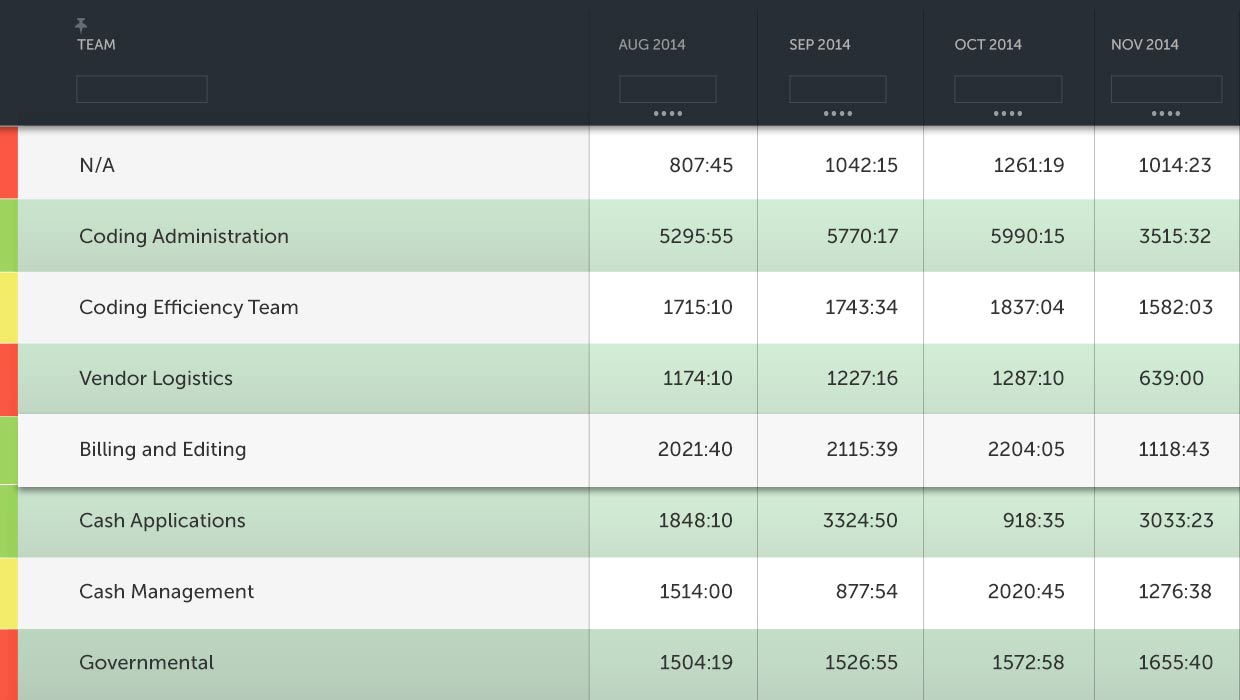
Team View
One click later, she sees that the Cash Applications team is squarely in the middle of the pack, except for one employee, who needs a training refresh to get her quality scores back up.
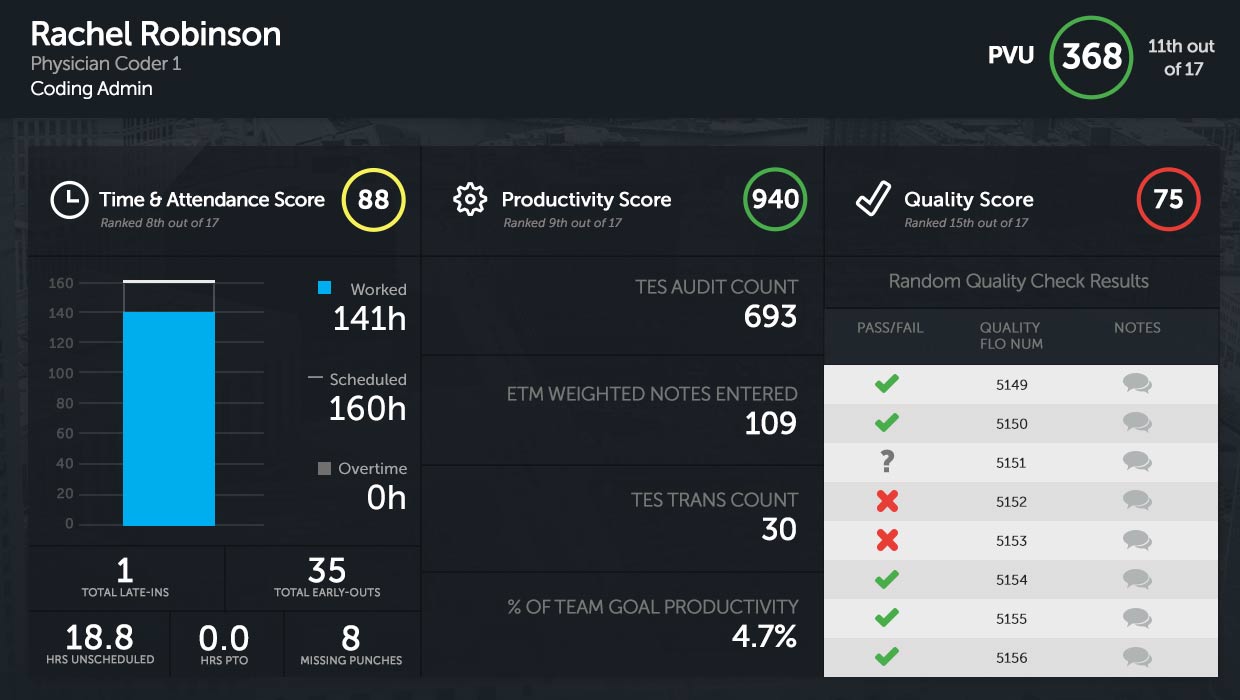
Team Member View
This employee leaves early every day to get her daughter from day care, so her time & attendance scores are dead last. But her productivity and quality scores are high. Instead of remedial action, her supervisor changes her timesheet parameters by 15 minutes, and her future scores reflect her real value to the enterprise.
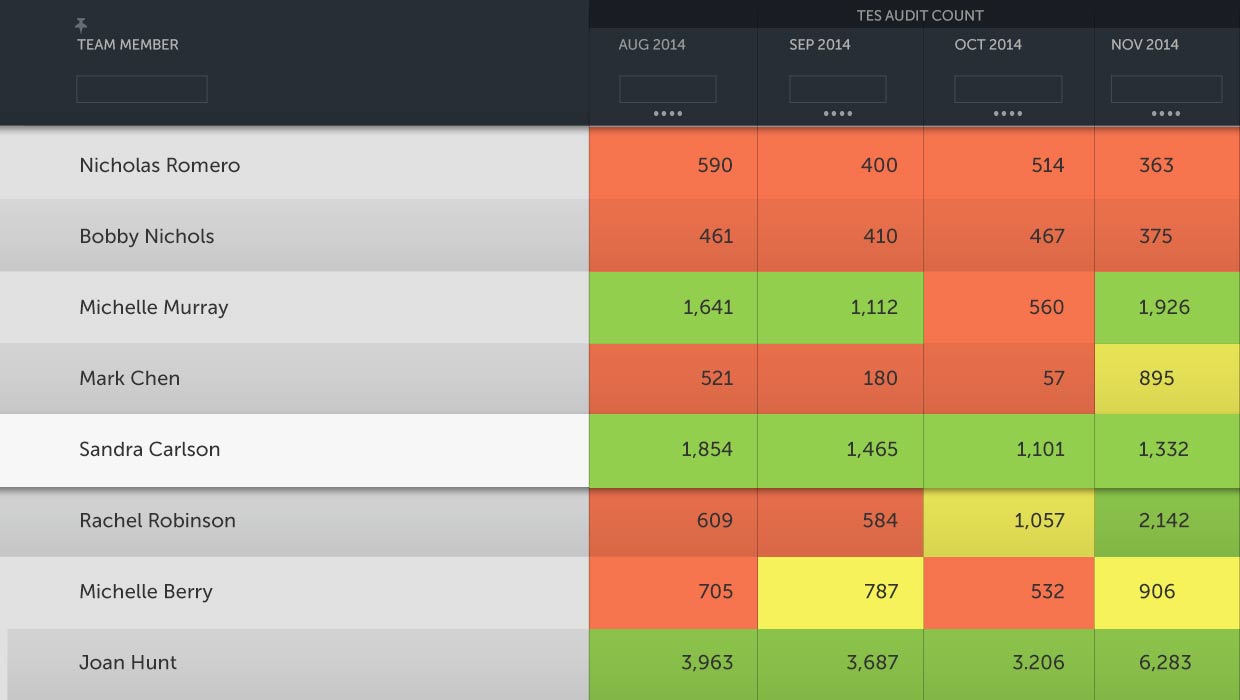
Custom View
With this flexible solution, it’s also easy to see how the whole department is performing on any specific task. This report clearly shows who excels at billing audits, who is hovering around average, and who needs to improve.
Time & Attendance
Our solution integrates this key data, then lets users view it through a large number of filters: by department, group, individual, time period, and more.
Follow us on social media


© 2024 VisiQuate, Inc. All Rights Reserved.