
- Solutions
Healthcare
- Resources
Denials Management Analytics
The best way to look at denials is when they’re overturned.

“
Our approach to denial resolution is bound to deep longitudinal patient analytics. This lets our clients see the root causes that underlie every part of a claim at the atomic level, from beginning to end.
– Keith Eggert, FHFMA
The way we see it, every open claim over 45 days old is a defect. And attacking them one at a time is no solution at all. So we’ve designed our Denials Management Analytics to make the root causes that underlie entire groups of denials crystal clear. Created by leading industry subject matter experts, including our clients, this solution is designed to facilitate data-driven denials management optimization. The result? Fewer denials, improved overturn rates and reduced costs to collect.
To make it even more valuable, DenialFlo™, our advanced worklisting solution, optimizes the assignment of your denials inventory to maximize work output from your staff and vendors. The result? It’s like discovering overlooked pockets of cash in your A/R portfolio.
Key Features & Benefits
- Comprehensive 837/835 de-duping and parsing (full/partial & claim/line level)
- Unified denials management across all facilities and source systems
- Root cause analysis and denial pattern detection
- Drag and drop report and dashboard building
- Accelerates payer cashflow
- Decreases first pass denials and Improves overturn
- Recovers underpayments
- Improves payer negotiations
- Denial scoring for likelihood of overturn
Think macro; act micro.
We didn’t design this solution to zoom from 30,000 feet to a single account because it looks cool in a demo; we did it because it works. Besides giving managers a satellite view of the battlefield, this solution delivers progressively granular views that include denial rate trending by facility, service line, payer, department, and down to one single coder. The example below is just one of thousands, but it should give you a good idea of how this solution works.
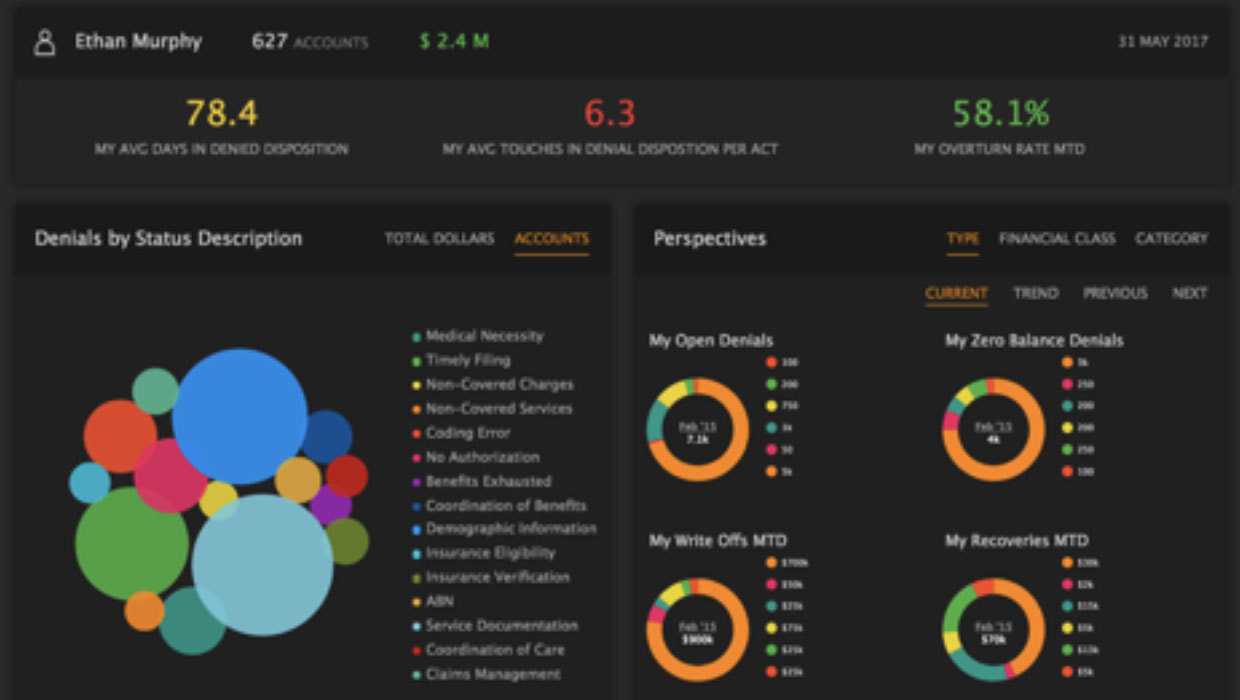
Tailored visual insights
VisiQuate tailors visual insights to the needs of users in each key area who are responsible for overturning denials. We deliver infographics, location analytics, scorecards and other key visual insights. All widgets are interactive, with easy access to deeper detail to drive actionability.
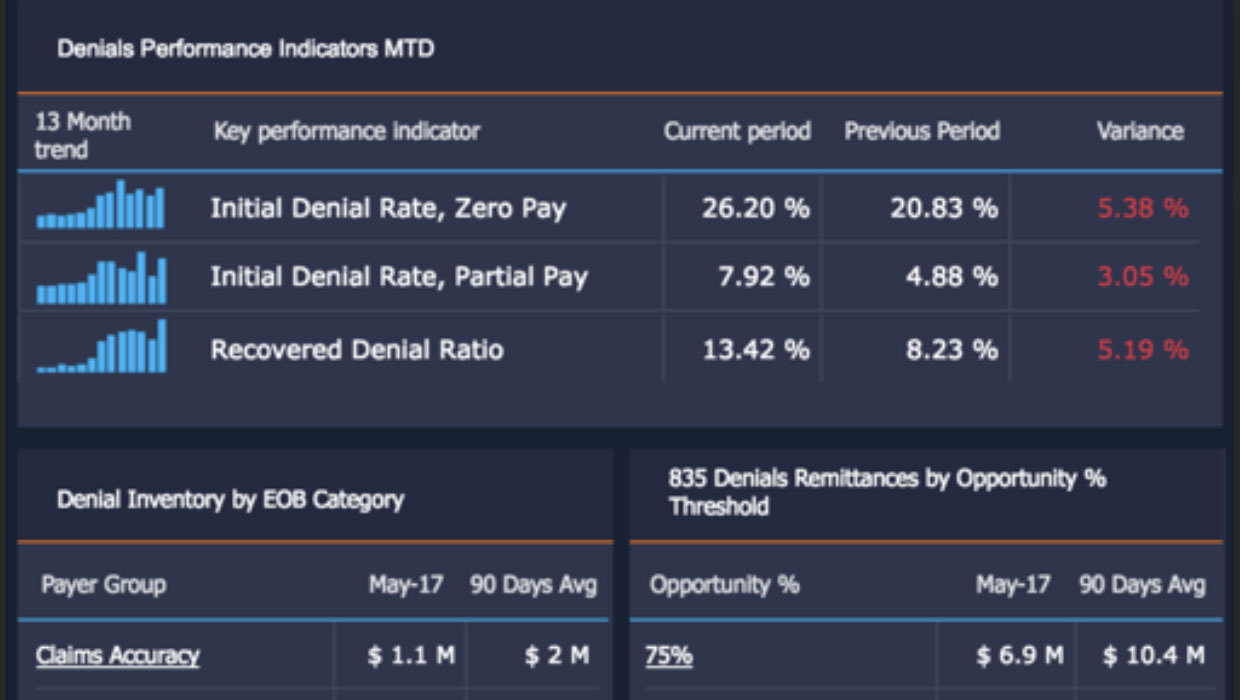
Denials inventory breakdowns
There are any number of ways to look at accountable areas of denial: by facility, service area, revenue cycle function, payer, team, and more. We give you the flexibility to set dynamic thresholds that identify opportunities for improvement in all those areas.
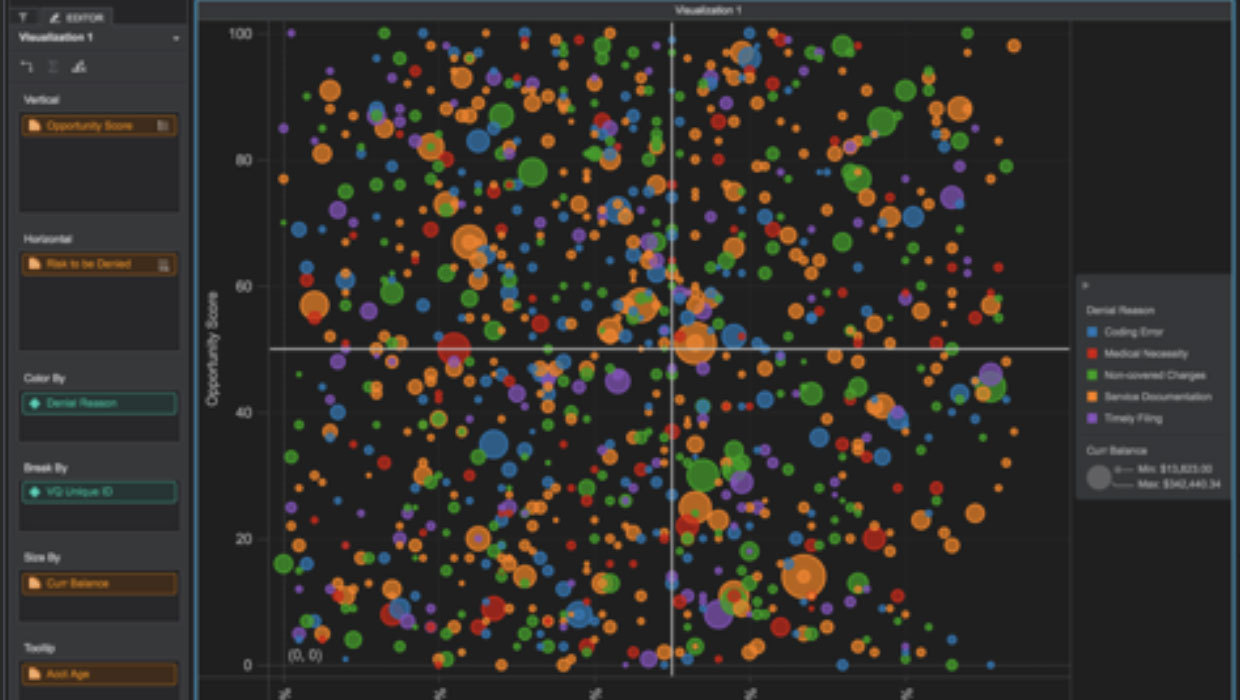
Outliers and anomalies
It’s never been easier to identify the vital few, even when they are constantly changing. Our visualizations make the outliers, anomalies and key risk segments jump off the screen so you can take quick, decisive action.
Root cause by accountable area
Imagine how effective overturns would be if every penny of every denied claim were tied to an identifiable underlying root cause. That is exactly what this solution gives you.
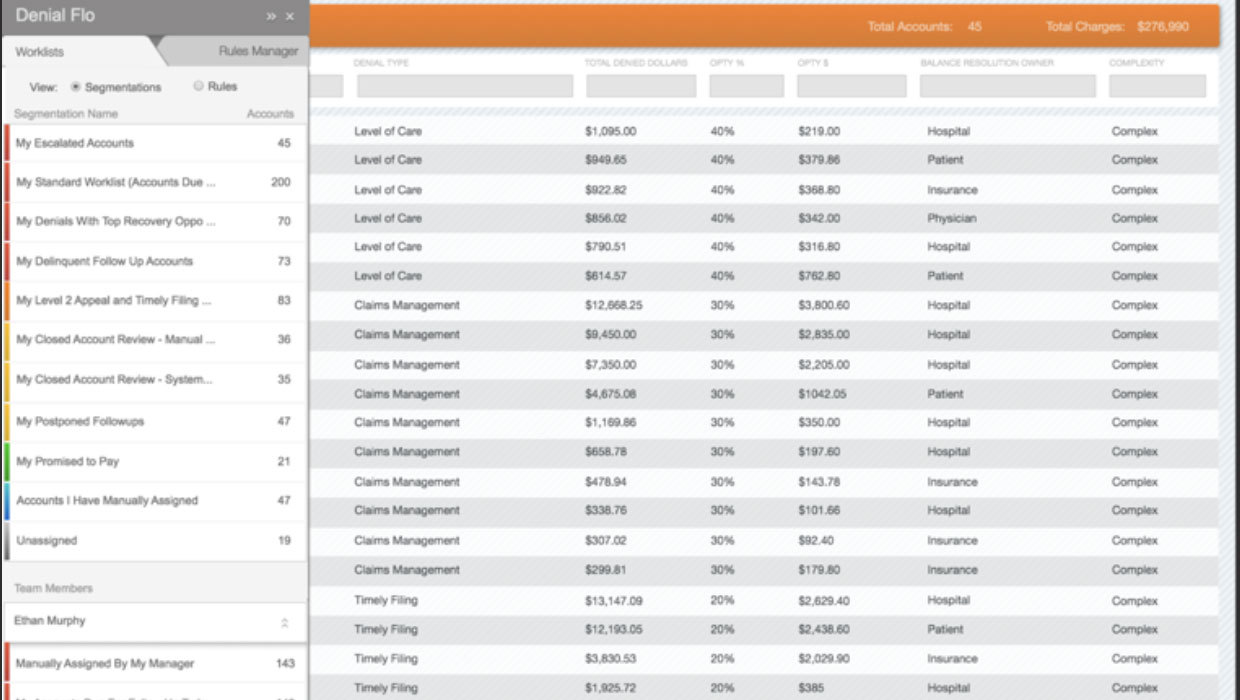
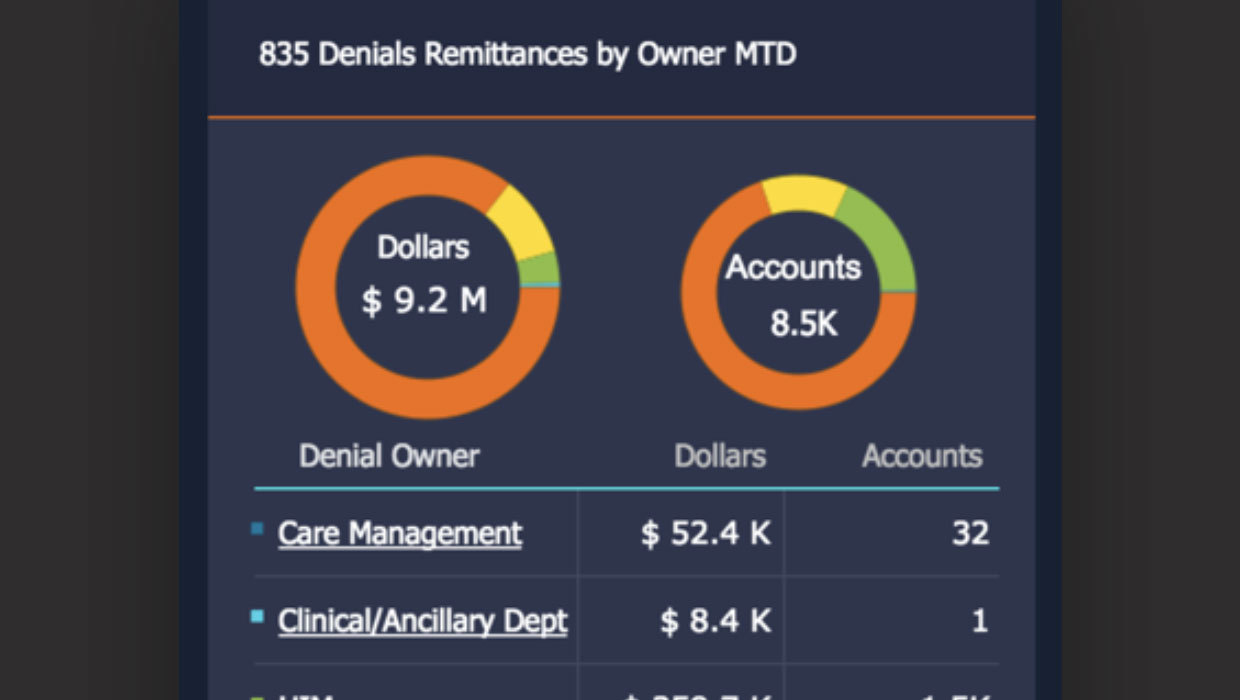
Detailed worklisting
Since the whole idea is to move the needle, DenialFlo™, our advanced worklisting engine, prioritizes denials and assigns each to the person who is best qualified to overturn it.
Follow us on social media


© 2024 VisiQuate, Inc. All Rights Reserved.